


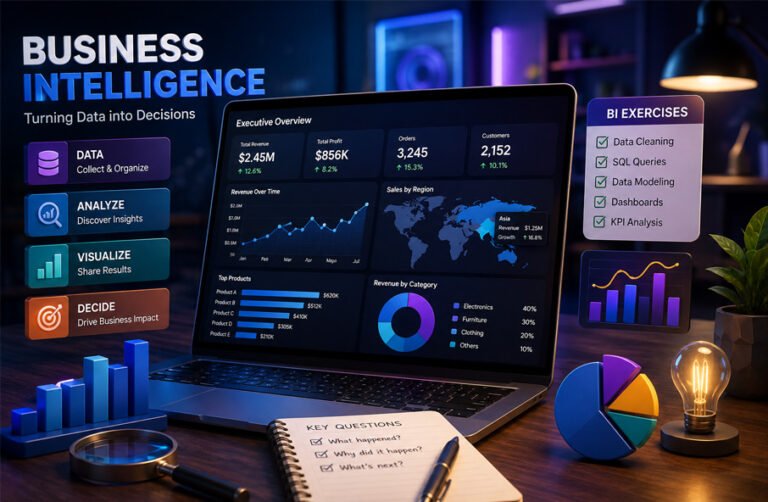
Business intelligence exercises are practical tasks used to learn how to collect, clean, analyze, and present business data. They help learners move beyond theory and understand how BI skills are used to answer real business questions.
People often search for these exercises to practice Power BI, Tableau, SQL, Excel, data modeling, dashboards, KPIs, and data analysis. This guide explains the main BI skills to practice and gives exercises for beginner, intermediate, and advanced learners.
What Are Business Intelligence Exercises?
Business intelligence exercises are hands-on tasks that help people practice BI skills. Instead of only reading about data analysis, learners work with actual or sample data and try to answer a business question.
A typical BI exercise starts with a problem. For example, a company may want to know why sales fell in one region or which products generate the highest profit.
The learner then works through a process such as:
Business question
Data
Cleaning
Modeling
Analysis
Visualization
Insight
Recommendation
The final result may be a dashboard, report, SQL query, analysis, or short recommendation.
Business intelligence is not only about making charts. A complete BI project may involve collecting information from different sources, fixing data quality problems, connecting tables, calculating important metrics, finding patterns, and explaining what those patterns mean.
For example, a sales exercise could use tables for customers, products, orders, dates, and regions. The learner might calculate revenue and profit, compare regions, and then build a dashboard showing where performance is improving or declining.
Why Practice Business Intelligence Exercises?
BI tools contain many features, but knowing where buttons are located is not enough. Practical exercises teach learners how to use those features to solve business problems.
Regular practice improves data preparation skills. Real data can contain missing values, duplicates, incorrect formats, and inconsistent names. Cleaning exercises teach learners how to identify and correct these problems before analysis begins.
Exercises also develop analytical thinking. Instead of simply asking, “How do I create a bar chart?” a stronger exercise may ask, “Which region is performing poorly, and what is causing the problem?” The second question requires the learner to investigate the data and explain the result.
Business intelligence exercises can also improve:
-
SQL and querying skills
-
KPI selection and calculation
-
dashboard design
-
data modeling
-
trend analysis
-
problem solving
-
reporting
-
communication with nontechnical users
They are also useful for job preparation. BI interviews can include SQL questions, data-cleaning tasks, dashboard assignments, or business scenarios. Completed exercises can also become portfolio projects if they clearly show the problem, analysis, findings, and recommendations.
Core BI Skills to Practice
A good set of business intelligence exercises should cover more than one part of the BI process.
Data Collection and Integration
Business data can come from Excel files, CSV files, databases, cloud systems, APIs, and business applications.
A useful exercise may require combining sales records with customer or product information. This teaches learners how information from different systems can be brought together for analysis.
Data Cleaning
Poor data can produce incorrect results. Data-cleaning exercises should include common problems such as missing information, duplicate records, incorrect data types, inconsistent dates, and different spellings for the same category.
Tools such as Excel, Power Query, Tableau Prep, Python, and SQL can all be used for this work.
Data Modeling
Data modeling shows how different tables relate to each other.
Learners should understand fact tables, which usually contain measurable events such as sales transactions, and dimension tables, which describe areas such as customers, products, dates, or locations.
Practice can also include primary and foreign keys, one-to-many relationships, star schemas, and basic snowflake schemas.
SQL and Querying
SQL is useful because much business information is stored in relational databases.
Beginner exercises can cover SELECT, WHERE, ORDER BY, GROUP BY, joins, and aggregate functions such as SUM, COUNT, and AVG.
More advanced exercises can include date calculations, rankings, common table expressions, and window functions.
KPIs and Calculations
A KPI is a measure used to track an important business result.
Common BI exercises may calculate revenue, gross profit, profit margin, sales growth, conversion rate, customer retention, average order value, budget variance, or employee turnover.
The correct KPI depends on the business question. Adding many metrics does not automatically make a dashboard more useful.
Visualization and Dashboards
Visualization exercises teach learners how to present information clearly.
Bar charts can compare categories. Line charts are useful for trends over time. Maps can show geographic differences. Tables are useful when exact numbers matter.
Learners should also practice filters, slicers, drill-down features, conditional formatting, and clear dashboard layouts.
Analysis and Communication
The final step is understanding what the data means.
A BI analyst should be able to identify trends, unusual results, strong and weak areas, and possible reasons behind changes. The findings should then be explained in simple language so that managers or other users can understand them.
Business Intelligence Exercises for Beginners
Beginners should start with small datasets and clear questions. There is no need to begin with complex predictive models or large databases.
One useful first exercise is cleaning a messy dataset. Take an Excel or CSV file and look for duplicate rows, blank values, inconsistent dates, incorrect data types, and spelling differences. Clean the file before creating any charts.
Another good exercise is creating basic visualizations. Use a sales dataset to make a bar chart for sales by product, a line chart for monthly revenue, and a table showing the best-performing customers.
A simple sales dashboard is also a useful beginner project. It can show total sales, profit, number of orders, average order value, and monthly trends. Filters can be added for date, region, or product category.
Beginners can also practice simple SQL questions such as:
-
Which customers spent the most?
-
What were total sales by region?
-
Which products generated the most revenue?
-
How many orders were placed during a certain period?
Another useful task is a basic KPI scorecard. For example, learners can compare actual monthly sales with a sales target and show whether performance is above or below the goal.
These exercises help beginners understand how raw information becomes a useful business report.
Intermediate Business Intelligence Exercises
Intermediate exercises should involve more tables, calculations, and business questions.
A good project is combining several data sources. For example, a learner might connect CRM customer data with an Excel sales file and a separate product table. The goal is to create one reliable dataset for analysis.
Data modeling becomes more important at this level. A practice model might contain Orders, Customers, Products, Dates, and Regions. Learners can create relationships between these tables and check that totals remain accurate.
Intermediate learners should also practice calculated measures such as year-over-year sales growth, profit margin, customer retention, and budget variance. In Power BI, this may involve DAX. Other tools provide their own calculated-field features.
Interactive dashboard exercises can include filters, slicers, geographic views, and drill-down. A user might start with total company sales and then move down to a region, product category, or individual product.
Time-based analysis is another useful skill. Learners can compare monthly, quarterly, and yearly results, identify seasonal patterns, and create basic forecasts.
At this stage, exercises should begin to feel more like workplace BI projects rather than isolated software tasks.
Advanced Business Intelligence Exercises
Advanced exercises combine BI with deeper analytical methods. They are most useful after the learner already understands data cleaning, modeling, SQL, KPIs, and dashboards.
Customer Segmentation with RFM Analysis
RFM analysis groups customers using three measures:
Recency shows how recently a customer purchased. Frequency shows how often they purchase. Monetary value shows how much they spend.
Learners can calculate these values, create customer scores, and group customers into useful segments. The results may support retention, marketing, or personalization decisions.
Inventory Optimization
An inventory exercise can analyze historical demand, stock levels, lead times, and product movement.
The learner may calculate reorder points, study stockout risks, compare different demand scenarios, and recommend inventory levels. More advanced projects can use optimization tools in Excel or Python.
Employee Retention Analysis
An HR exercise can examine factors linked with employee turnover. Data might include department, compensation, engagement, length of employment, and other approved workplace information.
Advanced learners may build a model that estimates turnover risk. These exercises require extra care because employee information can be private and sensitive. Data should be anonymized or properly authorized.
Market Basket Analysis
Market basket analysis looks for products that are often purchased together.
Common measures include support, confidence, and lift. The results can help explore possible product bundles, recommendations, or cross-selling opportunities.
Sentiment Analysis
Sentiment exercises analyze text such as customer comments or approved social-media data.
Learners can clean text, classify positive or negative sentiment, track changes over time, and compare sentiment with business measures. Data collection must follow privacy rules, platform terms, and applicable laws.
Predictive Analytics
Advanced BI practice can also include sales forecasting, demand forecasting, and customer churn prediction.
Tools such as Python and R can support regression, decision trees, and other statistical methods. Some BI platforms also include forecasting and predictive features.
Predictive results should be treated as estimates. They can support decisions, but they cannot guarantee what will happen in the future.
Real-World BI Exercise Ideas
Real-world business intelligence exercises are useful because they focus on a business question, not only on a software feature. They help learners understand how BI is used in daily work.
Sales Performance Analysis
A sales exercise can use order, customer, product, and regional data. The goal may be to understand where revenue is growing and where performance is weak.
Useful tasks include comparing sales over time, checking profit by product, finding top and bottom regions, and measuring growth. The final result can be a dashboard with filters for date, region, or product category.
Financial Variance Analysis
This exercise compares planned spending with actual spending.
Learners can calculate the difference between budget and actual results, show percentage variance, and find departments or cost areas with large changes. The final report should explain the main reasons behind important differences.
Customer Analysis
Customer exercises can focus on spending, purchase frequency, retention, and customer value.
For example, learners can identify high-value customers, compare customer groups, find people who have stopped buying, or study changes in buying behavior. These findings can support sales, service, or marketing decisions.
Marketing and Web Analytics
Marketing exercises can use website or campaign data to study traffic sources, conversions, user behavior, and advertising results.
A learner might compare conversion rates between campaigns, find where users leave a funnel, or calculate return on advertising spend. The main goal is to connect marketing activity with measurable business results.
Supply Chain and Inventory Analysis
Supply chain exercises can include supplier performance, inventory levels, delivery times, stock shortages, and costs.
A dashboard might compare suppliers by on-time delivery, product quality, and cost. Inventory exercises can also identify products that move slowly or may run out soon.
HR Analytics
HR exercises may cover headcount, hiring, employee turnover, time to hire, and department performance.
For example, a learner could compare turnover rates across departments or study hiring trends over several years. Employee information should be handled carefully because it may contain private data.
Executive Dashboard
An executive dashboard combines important information from several business areas.
It may include sales, finance, marketing, and operations data. The dashboard should focus on a small number of useful KPIs instead of showing every available metric.
Advanced exercises can also include drill-down, automated refresh, data-quality checks, and different views for managers.
SQL Exercises for Business Intelligence
SQL is an important BI skill because many companies store data in relational databases.
Beginners can practice SELECT, WHERE, ORDER BY, GROUP BY, and simple aggregate functions. They can then move to joins between tables such as Customers, Orders, Products, and Regions.
Useful practice questions include:
-
Which customers generated the most revenue?
-
What is average monthly revenue by region?
-
Which products have the highest return rate?
-
How have sales changed over time?
-
Which regions have the highest profit margins?
Intermediate learners can practice subqueries, common table expressions, date calculations, ranking, and window functions.
The results from SQL queries can then be used in Power BI, Tableau, Excel, or another reporting tool.
Data Visualization and Storytelling Exercises
Good BI work should make data easy to understand.
Visualization exercises teach learners to choose the right chart for each question. Bar charts are useful for comparing categories. Line charts show changes over time. Maps are useful for location-based analysis. Scatter plots can help study relationships between two measures.
Tables are still useful when exact values matter.
Learners should also practice dashboard layout, filters, slicers, labels, and drill-down. Interactive features should make a report easier to use, not more complicated.
Storytelling exercises can follow a simple structure: explain the problem, show the evidence, describe the main insight, and suggest a possible action.
This is important because business users often want to know what the numbers mean, not only see the numbers.
Best Tools for Practicing BI
Different tools are useful for different parts of business intelligence exercises.
Microsoft Power BI
Power BI is widely used for data preparation, modeling, calculations, dashboards, and reporting.
Power BI Desktop can connect to Excel files, databases, web sources, and other data sources. Power Query is used for cleaning and transforming data, while DAX can be used for more advanced calculations.
Microsoft also provides official sample datasets and reports that learners can use for practice.
Tableau
Tableau is mainly used for visual analysis and interactive dashboards.
Its Sample Superstore dataset is commonly used for learning sales, profit, customer, and regional analysis. Tableau Prep can be used for data cleaning and preparation.
Tableau Public is useful for learning and public portfolio projects, but published work is public. Confidential company data should not be uploaded there.
Excel
Excel is still useful for BI practice, especially for beginners.
Learners can practice formulas, PivotTables, charts, Power Query, basic dashboards, and simple financial analysis. It is also useful for understanding data before moving to larger BI platforms.
SQL
SQL is used to retrieve, filter, combine, and summarize database data.
Learning SQL helps BI professionals work more independently and understand how their data is stored.
Python and R
Python and R are more useful for advanced analysis.
They can support forecasting, statistical analysis, machine learning, text analysis, and automation. They are not required for every BI role, but they can expand the types of problems a learner can solve.
Other BI Platforms
Other platforms include IBM Cognos and Qlik. These tools are often used for dashboards, reporting, enterprise analytics, and governed business data.
Learners do not need to study every BI platform at the same time. It is usually better to become comfortable with one main BI tool and SQL before adding more tools.
Where to Find BI Practice Datasets and Exercises
Official learning resources are a good starting point because they usually include clear sample data and instructions.
Microsoft Learn provides Power BI samples for areas such as retail, customer profitability, procurement, HR, sales opportunities, and corporate spending.
Tableau provides Sample Superstore and other sample datasets for practicing charts, dashboards, and analysis.
Public dataset websites such as Kaggle can also provide data for sales, finance, marketing, transport, health, and many other subjects. Learners should still check the quality and description of each dataset before using it.
SQL practice platforms, online courses, GitHub projects, and community BI challenges can provide more exercises.
Beginners should start with clean, documented data. Later, they can move to larger datasets with missing values, several tables, and inconsistent records.
How to Choose the Right BI Exercise
Choose an exercise based on the skill you want to improve.
A beginner who is learning Power BI may start with a small sales dashboard. Someone learning SQL may focus on customer and order queries. A more experienced learner may choose forecasting or multi-source reporting.
The exercise should also include a clear business question. “Create a chart” is less useful than “Find which region is losing profit and explain why.”
Good practice data should contain enough useful fields to answer the question. It should also include measures such as sales or profit and dimensions such as product, customer, date, or region.
As skills improve, learners can use less-clean data and more complicated business problems.
Common Mistakes to Avoid
One common mistake is starting a dashboard before understanding the business question. This often leads to reports that contain many charts but provide little useful information.
Another problem is using too many KPIs. A dashboard should focus on the measures that actually help answer the question.
Data quality should also be checked before analysis. Missing records, duplicates, incorrect dates, and bad relationships can produce misleading results.
Learners should avoid choosing charts only because they look attractive. The chart should match the information being shown.
Calculations should also be checked against source totals. A measure that looks correct may still be wrong because of a filtering or relationship problem.
Another mistake is assuming that two related trends prove that one caused the other. BI can show patterns and relationships, but further evidence may be needed to explain the cause.
Sample datasets also have limits. They are often cleaner and simpler than real company data.
Using BI Exercises for a Portfolio and Career
Business intelligence exercises can become useful portfolio projects.
A strong project should explain the business question, the dataset, the cleaning process, important calculations, and the final dashboard or report.
It should also explain the main findings and any reasonable recommendations.
For example, instead of showing only a sales dashboard, a portfolio project can explain that one region had falling profit because discount levels increased while sales volume stayed almost unchanged.
BI exercises can also help with job interviews. Employers may ask candidates to clean data, write SQL queries, calculate KPIs, build a dashboard, or explain an unusual result.
A portfolio shows both technical skills and the ability to understand a business problem.
Data Privacy and Security When Practicing BI
Public sample data is usually the safest choice for learning.
Real workplace data may contain customer names, employee information, financial records, internal forecasts, or other confidential information. It should not be copied into personal projects without permission.
Sensitive data should be removed, anonymized, or replaced with synthetic data when necessary.
Special care is needed with public platforms. For example, Tableau Public is designed for publicly shared visualizations, so confidential data should not be published there.
People-related analysis also needs extra care. Employee retention or performance projects should use approved data and respect privacy, access, and ethical rules.
Tips for Getting Better at Business Intelligence
Regular hands-on practice is more useful than only watching tutorials.
Start each project with a clear business question. Check the quality of the data before analyzing it. Learn enough SQL to explore data without depending completely on prepared reports.
Try to understand why each KPI is important instead of only learning the formula.
After finishing a dashboard, explain the results in simple words. Ask what a manager could actually do with the information.
It is also useful to return to older projects and improve them after learning new skills. This makes progress easier to see and helps strengthen weak areas.
Bottom Line
Business intelligence exercises help learners practice the complete BI process, from raw data to useful business decisions.
Beginners can start with data cleaning, simple SQL, charts, KPI scorecards, and basic dashboards. Intermediate learners can work with data models, several data sources, calculated measures, and interactive reports.
Advanced learners can move into customer segmentation, forecasting, inventory optimization, predictive analysis, and executive dashboards.
The main goal is not simply to create reports. Good BI practice teaches learners how to understand a business question, find useful information in data, and explain what action may be needed.
Frequently Asked Questions
What are business intelligence exercises?
Business intelligence exercises are practical tasks used to learn data cleaning, SQL, modeling, analysis, KPIs, dashboards, and reporting. They usually use a dataset and a business question.
What are the best BI exercises for beginners?
Good beginner exercises include cleaning a CSV file, writing simple SQL queries, creating charts, building a sales dashboard, and making a basic KPI scorecard.
Can I practice business intelligence for free?
Yes. Free sample datasets and learning resources are available from sources such as Microsoft Learn, Tableau, and public dataset platforms. Some BI tools also provide free learning options, although features and licensing can vary.
Which tool should I learn first for business intelligence?
It depends on your goals. Excel is useful for basic analysis, while Power BI and Tableau are common choices for dashboards. SQL is also highly useful because it helps learners work directly with database data.
Where can I find datasets for BI exercises?
You can use official Power BI samples, Tableau Sample Superstore, public datasets, Kaggle datasets, SQL practice databases, and other reputable learning resources.
Is SQL necessary for business intelligence?
Not every BI task requires SQL, but it is a valuable skill. It helps analysts retrieve, combine, filter, and summarize data stored in relational databases.
How can I practice real-world business intelligence?
Use exercises built around a clear business problem. Work with several tables, clean imperfect data, calculate useful KPIs, create a dashboard, and explain what the findings mean for the business.
Can business intelligence exercises help build a portfolio?
Yes. A complete BI exercise can show data cleaning, SQL, modeling, calculations, dashboard design, analytical thinking, and communication skills. The strongest portfolio projects also explain the business question, findings, and recommendations.
More To Explore:
Growth Navigate Startup Tools: Complete Guide for Startups in 2026
